
Free Online Check Server Status Tutorial
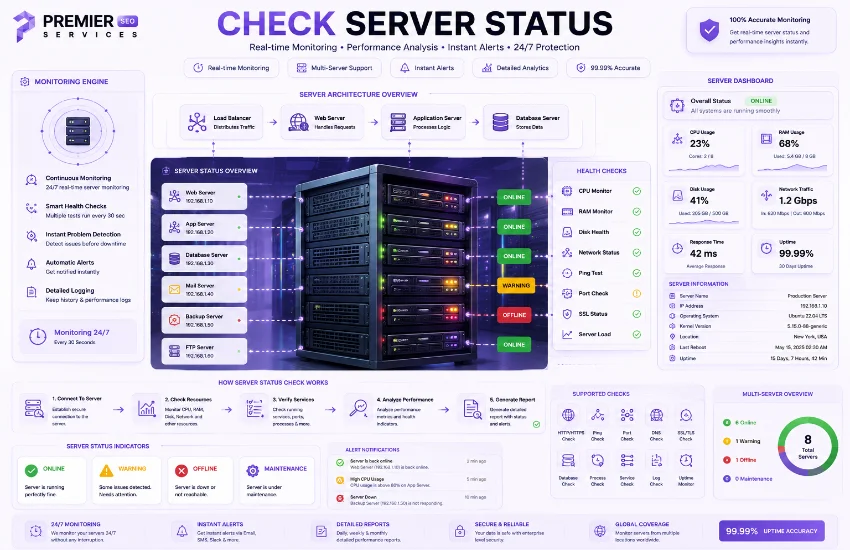
This tool runs real-time server diagnostics against any website URL. It checks HTTP status, response time, page size, redirects, HTTPS security, WordPress detection, Google Analytics, Facebook Pixel, CMS generator, and meta robots all through one unified interface.
Check Server Status with the URL Input
The input card is the launch point for every server check. A monospace text field accepts any website URL with a placeholder showing https://yourserver.com as a guide. If you type a URL without the protocol prefix, the tool automatically prepends https:// before sending the request, so entering nginx.org works the same as https://nginx.org. The input has a teal border that accentuates when focused, and an type="url" attribute triggers browser-level URL validation on mobile keyboards. Above the field, the card header displays a server emoji with the label Enter Server / Website URL and two mini buttons for quick actions. This is the most direct way to check server status from any device without installing command-line tools.
Server Status Checker Quick Buttons
Two mini buttons live inside the card header for convenience. The Example button prefills the input with https://nginx.org, the official Nginx web server project page, giving you a reliable and fast-responding test target. The Clear button empties the input field and hides any visible results including the stats grid, check cards, and details table, returning the interface to its clean initial state. You can also press the Enter key while focused on the input field to trigger a check, which is faster than clicking the button. These convenience features make the server status checker workflow efficient for both single checks and repeated monitoring sessions.
Check Website Server Status with the Main Button
The Check Server button dominates the right side of the input row with a teal gradient background and a computer emoji. Clicking it triggers the full diagnostic sequence. The button immediately disables itself to prevent duplicate submissions, reduces opacity to 60%, and the cursor changes to not-allowed. At the same moment, a loading card appears below with a circular spinner animation and the text Running server diagnostics. The loading state persists until the proxy chain returns data or all proxies fail. The entire diagnostic including proxy overhead typically completes in 1 to 4 seconds for healthy servers. This loading sequence is how the tool performs a server status checker operation with clear visual feedback at every stage.
Check a Server Status Using the Proxy Chain
Behind the scenes, the tool does not call the target server directly. Instead, it routes requests through a chain of three CORS proxy services. The primary proxy is allorigins.win, which returns a JSON wrapper containing the HTTP status code, headers, and full HTML content. If allorigins fails, the tool falls back to corsproxy.io which passes through the raw response including status and content type headers. The third fallback is codetabs.com. Each proxy attempt has a 12-second timeout using AbortController. The response is validated to ensure content exists before accepting it. If all three proxies fail, a descriptive error alert explains the issue. This fallback architecture is how the tool reliably performs a check a server status call across different network environments and browser CORS policies.
Server Status Check Results and Statistics
After the proxy returns data, the loading spinner disappears and the results section springs to life. A four-column stats grid sits at the top showing the most critical metrics at a glance. The HTTP Status card displays the numeric response code such as 200, 301, or 404. The color changes dynamically green for successful codes between 200 and 499, red for server errors above 500. The Response Time card shows the total elapsed time in milliseconds or seconds with color coding green under 1 second, amber under 3 seconds, and red above 3 seconds. The Response Size card displays the raw HTML size in bytes or kilobytes. The Redirects card shows Yes or No with blue for redirected and green for direct. These four metrics form the core of every server status checker and provide instant server health assessment.
Check My Server Status with Time and Size
The response time calculation starts with a timestamp recorded at the exact moment the Check Server button is clicked using Date.now(). When the proxy returns data, a second timestamp is captured and the difference is calculated. Times under 1000 milliseconds display as raw ms, while times above display as seconds with one decimal place. The response size is computed by creating a Blob from the full HTML text and reading its size property. Sizes under 1024 bytes display as bytes, while larger sizes convert to kilobytes with one decimal. These two metrics tell you whether the server is responding quickly and how much content it delivers. Anyone wanting to check my server status for performance evaluation will find these metrics the most actionable part of the results.
Check Server Status of a Website with Redirect Detection
The redirect detection compares the original requested URL against the final URL returned by the proxy. The tool strips trailing slashes before comparison to avoid false positives. If the URLs differ, the Redirects stat card shows Yes in blue. The redirect is also reflected in the check cards grid and the details table shows both the URL Checked and Final URL rows. This is important because a server that redirects may be slower due to the extra round trip, and the final URL may differ from what you intended to check. Understanding redirects is essential when you check server status of a website to ensure you are testing the actual endpoint and not a forwarded address.
Check Server Status of Website with Diagnostic Cards
Below the stats grid, a three-column check grid displays six diagnostic cards that provide qualitative assessments of the server. The Server Online card shows a green checkmark with Responding if the HTTP code is between 200 and 499, or a red cross with Not responding for codes 500 and above. The HTTPS and SSL card shows a lock emoji with Secure (HTTPS) or a warning emoji with Not secure (HTTP) depending on whether the final URL starts with https://. These cards use large emoji icons and color-coded result text for instant readability. The hover animation lifts each card with a spring effect. These visual indicators make the server status checker results scannable in under a second.
Check Site Server Status with Redirect and Speed Cards
The Redirect card in the check grid shows a loop arrow emoji if a redirect was detected with the text Has redirect in blue, or a green checkmark with No redirect if the URL was direct. The Speed card shows a lightning emoji for fast responses under 2 seconds or a turtle emoji for slower responses, with the speed label Fast, Moderate, or Slow and the exact elapsed time in milliseconds. These two cards together help you understand both the routing behavior and performance characteristics of the target server. A slow response with a redirect often indicates the redirect itself is causing the delay. This card pair is particularly useful when you check site server status to evaluate both correctness and performance in one view.
Check Server Status Online with CMS and Analytics Detection
The last two check cards provide platform intelligence. The WordPress card shows a blue diamond emoji with Detected if the HTML contains /wp-content/ or wp-json patterns, or a gray square with Not detected if absent. The Google Analytics card shows an orange chart emoji with Detected when the HTML includes google-analytics.com or gtag( patterns. The tool also checks for the Facebook Pixel by scanning for connect.facebook.net or fbq( in the HTML, though this appears in the details table rather than a separate card. These detections help identify the technology stack powering the server. This platform intelligence makes the check server status online tool valuable for competitive research and technology audits.
Frequently Asked Questions
Check Domain Server Status with Full Details Table
The details table is the most comprehensive section of the results, presenting eleven data rows in a structured table format. The table card has a header with a clipboard emoji and the label Server Details. Each row has an uppercase bold label on the left and a monospace value on the right. The table covers URL Checked showing what you entered, Final URL showing where the server actually responded, HTTP Status code, Content Type from the response headers, Page Title extracted from the HTML title tags, Response Time with the speed classification, CMS or Generator from meta tags, Meta Robots directive, Google Analytics presence, Facebook Pixel presence, and the exact Checked At timestamp. Hovering any row highlights it with a teal tint. This table is the definitive server status checker reference for anyone needing complete server diagnostic data.
Check DNS Server Status with URL and Status Rows
The first three rows of the details table establish the basic connection facts. The URL Checked row shows the exact input you provided after the tool prepended https:// if needed. The Final URL row reveals where the server actually responded, which may differ from the input if the server performed a redirect. The HTTP Status row displays the numeric code returned by the server, which categorizes the response into informational, success, redirect, client error, or server error classes. These three rows together tell you whether you reached the right server, whether it redirected you somewhere else, and whether the request succeeded or failed. This is the foundation of any check dns server status assessment because DNS resolution directly affects which IP address responds first.
Check Email Server Status with Content and Title Details
The Content Type row reveals the MIME type from the server response headers, such as text/html; charset=utf-8 which tells you what kind of content the server sends. The Page Title row extracts the text between the <title> tags using a regex match, truncated to 70 characters for readability. The Response Time row repeats the elapsed time with the speed classification appended, giving you both the raw number and a human-readable quality rating. These rows help verify that the server is returning the expected content type and a meaningful page title, which are basic health indicators. When you check email server status, similar content verification applies to ensure the mail server returns proper responses on its web interface.
Check FTP Server Status with Generator and Robots Rows
The CMS and Generator row scans the HTML response for a <meta name="generator"> tag, which many content management systems like WordPress, Drupal, and Joomla include to identify themselves. If found, the generator name appears in this row. The Meta Robots row extracts the <meta name="robots"> directive, which controls search engine crawling behavior with values like index, follow or noindex, nofollow. These metadata rows provide SEO and technology intelligence without any external lookups. For checking non-web servers, understanding these rows provides context about what platform generates the content. This is analogous to needing to check ftp server status where the FTP banner reveals the server software version.
Check Server Status by IP with Analytics Detection
The Google Analytics row scans for two distinct patterns in the HTML: google-analytics.com which detects the traditional Analytics script, and gtag( which detects the newer Google Tag Manager and Global Site Tag implementations. The Facebook Pixel row scans for connect.facebook.net the Facebook SDK connection script and fbq( the Facebook Pixel tracking call. These detections use simple string inclusion checks rather than complex parsing, making them fast and reliable. When the patterns are found, the row shows a green checkmark with Detected, otherwise shows Not found. These tracking detections help marketers and developers verify that their tracking codes are properly installed on the server. This is similar to needing to check server status by ip to verify that tracking scripts fire from the correct geographic location.
Check Server Status Linux and Technical Architecture
The three-proxy failover system is the backbone of the entire diagnostic tool. The first proxy, allorigins.win, provides a JSON-structured response with .contents for the HTML body and .status containing http_code, url, and content_type. The tool checks for a truthy status field to validate the response. The corsproxy.io proxy returns the raw HTML as text with the HTTP status available through r.status and content type through r.headers.get('content-type'). The codetabs.com proxy works similarly as a final fallback. Each proxy function is wrapped in a try-catch that silently moves to the next if the current one throws. The response is required to have content, and if a proxy returns a response without valid HTML, the tool continues to the next attempt. Understanding this architecture helps developers running check server status linux environments to anticipate how the tool behaves behind firewalls and restrictive networks.
Check Server Status Ubuntu with Response Parsing
Once the HTML response arrives, the tool parses it using regular expressions for multiple data points. The page title is extracted with /<title[^>]*>([^<]+)<\/title>/i. The generator meta tag uses /<meta[^>]+name=["']generator["'][^>]+content=["']([^"']+)/i. The robots meta uses a similar pattern. Google Analytics detection scans for google-analytics.com and gtag( anywhere in the HTML. Facebook Pixel detection scans for connect.facebook.net and fbq(. WordPress detection checks for /wp-content/ and wp-json patterns. These extractions run on every successful response regardless of the server type. For administrators wanting to check server status ubuntu or other Linux distributions, these parsing results provide immediate insight into what software stack the remote server is running.
Check Apache Server Status with Detection Systems
The detection systems cover three categories of server intelligence. WordPress detection helps identify sites running on the most popular CMS, which affects how you interpret response times and content structure. Google Analytics detection confirms whether traditional or Gtag analytics is present, which matters for marketing verification. Facebook Pixel detection confirms the Meta advertising pixel is installed, which is essential for ad campaign tracking. The tool also detects the HTTPS status by checking the final URL protocol. These detections run synchronously on the response HTML and the results populate both the check cards grid and the details table simultaneously. This combination of checks is comprehensive enough to check apache server status or any other web server software by analyzing what the server serves rather than what it advertises in headers.
Check Name Server Status with Real Use Cases
Server administrators use this tool to verify that newly deployed servers respond correctly before going live. Web developers use it to confirm that staging environments return the expected status codes and content types. SEO specialists use the redirect detection to verify that old URLs properly redirect to new ones. Marketing teams use the analytics and pixel detection to confirm tracking codes are installed. Security auditors use the HTTPS check to enforce SSL compliance across all company domains. Freelancers use it to quickly assess the health of client servers before starting maintenance work. The tool requires no login, no API key, and no installation, making it accessible from any browser on any operating system. These varied use cases show why many professionals check name server status alongside web server diagnostics to get the full picture of domain health.
Check Mail Server Status and Troubleshooting
When a server check fails, the proxy chain catches the error and the tool shows a browser alert with the message from the underlying error. Common failure reasons include the target server being actually offline, the proxy service being rate-limited, the target URL containing invalid characters, or a firewall blocking the proxy request. If the target server returns an empty response, the tool still accepts it but the content-based features like title extraction and detection will show Not found. The notice bar at the bottom of the page explains that response time includes proxy overhead of approximately 200 to 500 milliseconds, so actual server response time is slightly faster than displayed. For best results, use full URLs including the protocol, verify the target server is publicly accessible, and retry if a proxy timeout occurs. These troubleshooting practices apply whether you check mail server status or any other web-based server type.