Http Status Checker Tutorial
Whether you need to check HTTP status, use an http status code checker, or use an online HTTP Status Checker for bulk monitoring, this guide covers every feature across all four tool modes from single URL deep analysis to session-based uptime tracking.
Why HTTP Status Monitoring Matters
Every HTTP request returns a three-digit status code that tells you exactly what happened success, redirection, client error, or server failure. Left unchecked, broken pages, misconfigured redirects, and silent errors accumulate, degrading user experience and search performance. Having a reliable HTTP header checker at your disposal means you can verify exactly what your server is communicating, from content negotiation headers to caching directives and security policies. The HTTP Status Checker brings all of this into a single, streamlined interface you can use on any browser or device.
This exact http status code checker you are learning about run real-time checks on any URL to see status codes, response headers, SSL status, security posture, and SEO signals in a single interface.
What This Website Status Checker Does
This tool functions as a complete http status code checker, HTTP response checker, and URL status checker rolled into one interface. It operates across four distinct modes, each tailored to a different diagnostic scenario.
Server status monitoring goes hand in hand with HTTP checking understanding whether your server is reachable and responsive is the foundation of any performance audit.
1Single URL Deep Analysis
Type any URL into the input field and press Enter or click Check Status. The tool auto-prepends https:// if you omit the protocol. Below the URL field, several options let you customize exactly how the request is sent.
Request Configuration
The Request Method dropdown supports GET, HEAD (returns headers only much faster), POST, and OPTIONS. The User Agent selector lets you impersonate Googlebot, Bingbot, Desktop Chrome, Mobile Safari, Facebook Bot, Twitter Bot, or enter any custom string. Use the what is my browser tool to identify your own user agent first.
Variants & Timeout
The HTTP version variants option can check a single URL as-is, or automatically test HTTP vs HTTPS and WWW vs non-WWW in one click. The Timeout selector ranges from 5 to 30 seconds.
Speed testing complements http status code checker analysis even pages that return 200 OK can perform poorly. Combine both tools for a complete performance picture.
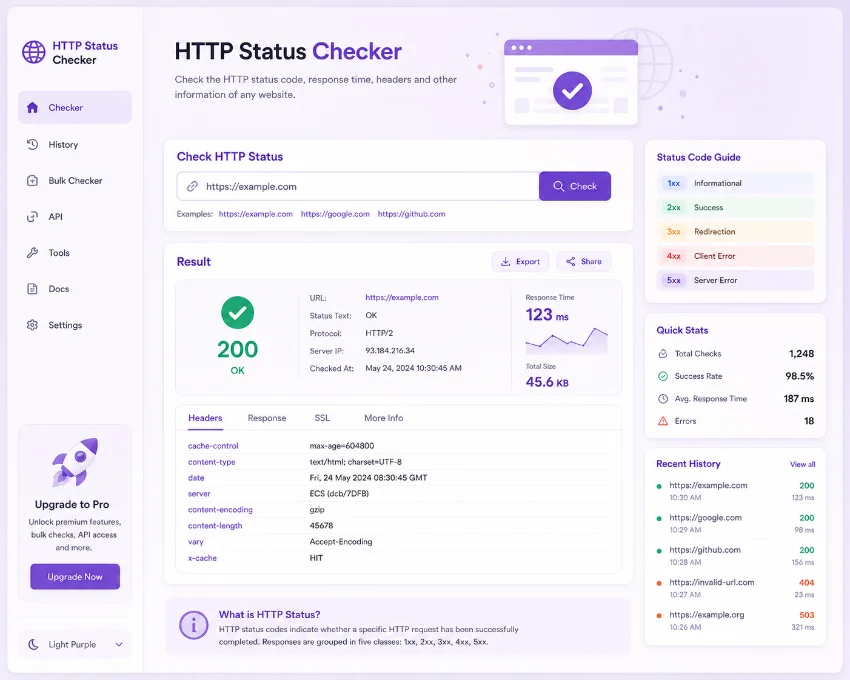
2Understanding the Results Dashboard
Once the analysis completes, a large color-coded badge dominates the results panel. The badge color maps directly to the response category:
Below the badge, a four-cell stats grid shows the status code, response time in milliseconds, content size, and content type. If you selected the variant-checking option, additional rows appear comparing HTTP vs HTTPS and WWW vs non-WWW side by side invaluable for spotting canonicalization issues.
While the HTTP checker gives you real-time status, the uptime monitor provides long-term reliability data that helps distinguish temporary glitches from systemic issues.
3Six Diagnostic Tabs Under Every URL
After each single-URL analysis, six result tabs give you a complete diagnostic cockpit. Each tab addresses a different layer of the server response.
🔍 Analysis Tab
Color-coded observations about the response whether the status code is healthy, if the response time is fast or slow, whether HTTPS is enforced, and any detected redirects. Every issue includes a clear recommendation.
📡 Headers Tab
Every response header sorted with important ones like content-type, cache-control, and location appearing first. Essential for debugging caching, content negotiation, and server configuration.
🔒 SSL/TLS Tab
Evaluates HTTPS connectivity, checks for HSTS headers, and validates encryption status. Essential for verifying secure configuration and identifying missing SSL protections.
🛡️ Security Tab
Scans for eight critical security headers HSTS, CSP, X-Frame-Options, X-Content-Type-Options, X-XSS-Protection, Referrer-Policy, Permissions-Policy, and Cache-Control and calculates a security score out of 100.
⚡ Performance Tab
Reviews response time, Cache-Control, ETag, Last-Modified, compression status, content size, and HTTP/2 support. Translates raw headers into actionable performance feedback.
🎯 SEO Signals Tab
For HTML responses returning 2xx, parses the title tag, meta description, H1 heading, and canonical URL. Also evaluates X-Robots-Tag, caching behavior, and explains the SEO implications of the status code.
Redirects directly affect HTTP status responses. The redirect checker maps entire chains so you can see how many hops a URL goes through before reaching its final destination.
4Bulk Checker Scan Multiple URLs at Once
When you need to check website status across many pages at once, switch to the Bulk Checker tab. Paste up to twenty-five URLs, one per line, select a user agent, and click Check All URLs. A live progress bar tracks the scan in real time. Once complete, summary badges at the top show the count of 2xx, 3xx, 4xx, and 5xx responses plus errors.
Use the Filter Results dropdown to isolate specific status categories particularly useful when auditing a large site for broken pages or unexpected redirects. Two export formats are available: CSV generates a spreadsheet with URL, status, status name, response time, content type, redirect flag, and error messages. JSON produces structured data suitable for programmatic analysis or pipeline integration.
Before diving into bulk HTTP checks, confirm your site is reachable. The availability checker gives you a quick yes-or-no on whether a page is up or down.
5URL Monitor Live Session-Based Tracking
The URL Monitor tab transforms the tool into a temporary uptime watchdog. Enter a URL, choose a check interval 30 seconds, 1 minute, 2 minutes, or 5 minutes and click Start Monitoring. The HTTP Status Checker repeatedly fetches the URL at your chosen interval and logs every response. A stats panel tracks the last status, total checks performed, live uptime percentage, and most recent response time. If the status code changes between checks, the entry is highlighted and a toast notification fires. The monitor runs as long as the browser tab stays open, making it ideal for deployment verification or debugging intermittent issues.
Page size directly affects HTTP response times. Combining status monitoring with page weight analysis helps you distinguish between server-related slowness and content bloat.
6Status Reference Built-in Knowledge Base
The Status Reference tab contains a searchable database of HTTP status codes organized by category 1xx Informational, 2xx Success, 3xx Redirection, 4xx Client Errors, and 5xx Server Errors. Each entry displays the numeric code, official name, and a plain-English description. A search field lets you filter by code number, name, or description. Every row includes a Test button that loads the corresponding httpstat.us URL into the Single URL checker and runs the analysis a practical way to learn how different status codes behave in the wild.
Different user agents can receive different HTTP responses. Cross-browser testing reveals discrepancies in how various browsers and bots experience your site.
Who Should Use This Tool and When
Website owners, SEO professionals, developers, and system administrators all benefit from the HTTP Status Checker. Use it after deploying new pages to confirm 200 responses, before migrating domains to verify redirect chains, during SEO audits to locate broken links, and after server configuration changes to validate security headers. The built-in Status Reference combined with the Test buttons also makes this a valuable educational resource for anyone learning how the HTTP protocol works under real conditions.
Whether debugging a single page or auditing an entire domain, running the http status code checker helps you catch broken responses before they impact users and search rankings.
Build a Healthier, More Reliable Website
The HTTP Status Checker equips you with everything you need to monitor, diagnose, and improve how your server communicates with browsers and bots. From single-URL deep dives to bulk scanning and live monitoring, integrating these checks into your regular maintenance routine prevents small issues from escalating into costly problems.
Frequently Asked Questions
Robots.txt rules influence which URLs get crawled. Verifying HTTP status codes alongside robots.txt configuration ensures search engines reach the right pages without hitting blocked resources.